Combing the Hairball
 isbscience.org/news/2012/12/19/combing-the-hairball/

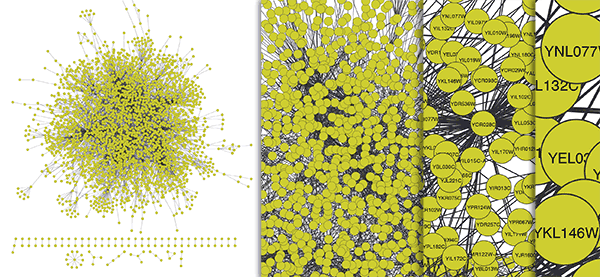
Traditional node-link diagram of a network of yeast protein-protein and protein-DNA interactions with over 3,000 nodes and 6,800 links. Data from: von Mering et. al. Nature, 417, 399-403, May 2002; Lee et. al. Science, 298: 799-804 (2002)
The node-link diagram above is a “hairball” of biological network data. Because it’s such a large network, it’s hard to scan for patterns or interesting interactions worth further investigation. But Bill Longabaugh, a senior software engineer at ISB, is on a mission to comb such hairballs with a new software program he designed called BioFabric.
Node-link diagrams are a long-standing and intuitive way to visualize a biological network. Nodes may represent proteins, genes or any number of data types, while the relationships or interactions between them appear as edges. The diagram above was created using Cytoscape, a software platform that ISB scientists and engineers pioneered more than 10 years ago that helps to analyze and visualize biological networks. Network analysis is an essential component of systems biology and Cytoscape is used around the world today. But, as the above diagram illustrates, the node-link displays of large networks provided by Cytoscape and other similar programs are difficult to interpret.
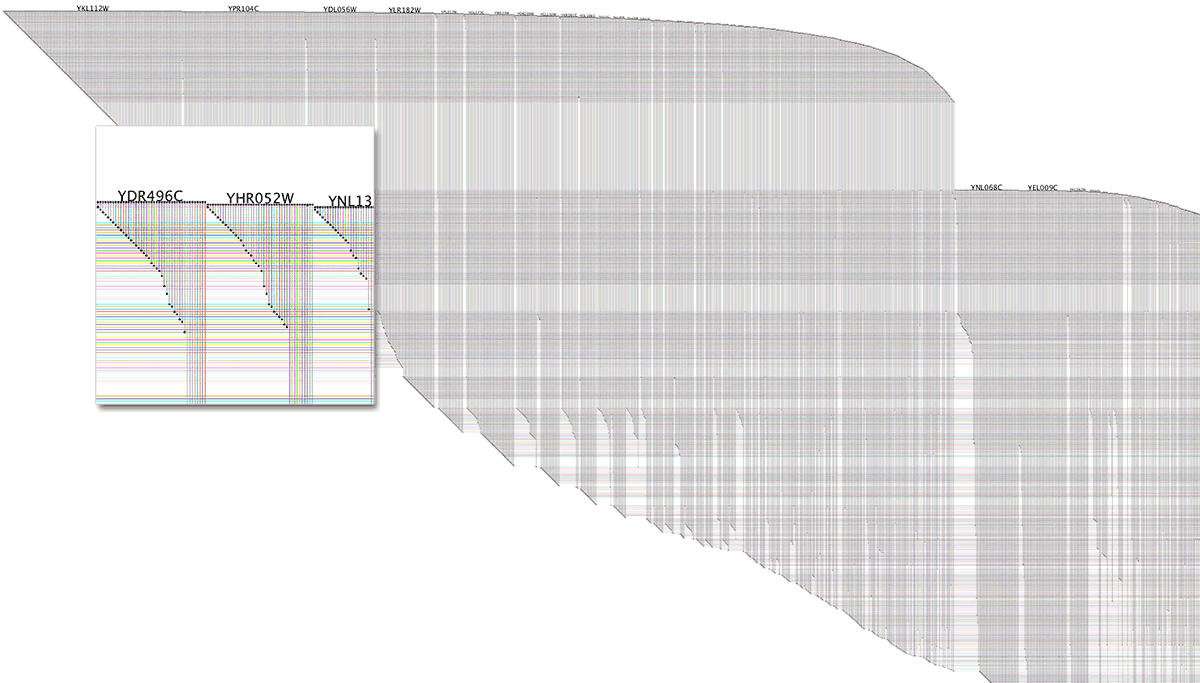
BioFabric elegantly represents nodes as horizontal lines and edges as vertical lines. The example below is the “combed” version of data represented above. At ISB, we always emphasize our cross-disciplinary and collaborative teams. It takes engineers like Bill to work with our scientists to develop novel technologies that help drive new biological discoveries.


