Data Vis Meetup Held at ISB
 isbscience.org/news/2014/05/02/data-vis-meetup-held-at-isb/
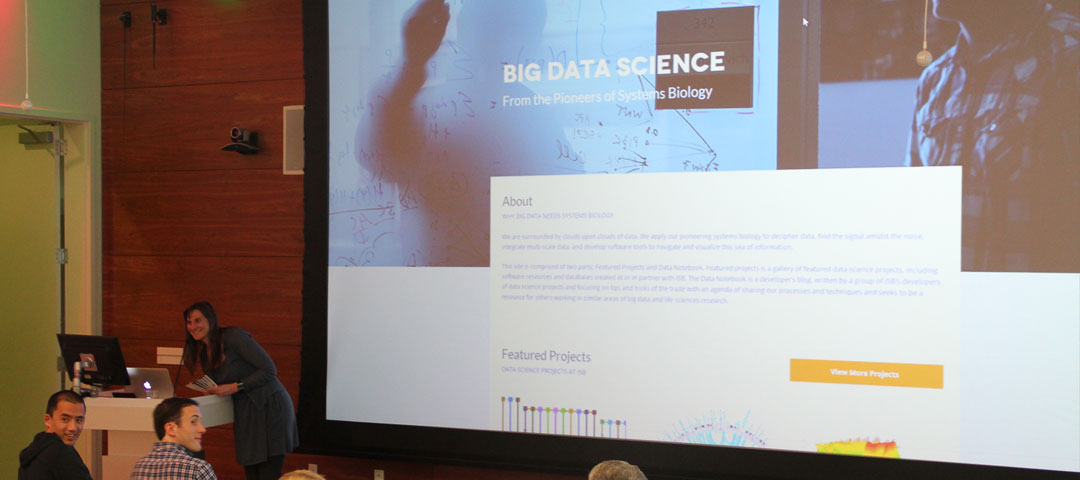
Pictured above: Allison Kudla presents ISB’s Big Data Science site at the start of the meetup.
ISB hosted the Seattle Vis meetup group this past Wednesday (April 30). The meetup was organized by The guest speakers were Ryan Lucas and Kevin Lynagh, who have created a very stylistic charting library based on a grammar of graphics. They are an independent data vis consulting group based out of Portland. https://variancecharts.com/
Description of the meetup:
Data visualization serves two primary roles: to facilitate analysis and to illustrate meaning for a larger audience. This latter task is well-suited to the expertise of a designer, yet data graphics tools are customarily biased towards the technician. Is it possible to bring powerful data graphics tools to the product design process? In this talk, we’ll share how our Variance charting framework integrates a powerful grammar of graphics with the web standard workflow. Through examples, we’ll explore how embracing the traditional web HTML+CSS workflow (rather than fighting it with elaborate D3 code or embedded iframe schemes) allows one to more effectively prototype novel visualizations, test with users, make responsive choices, and combine visualizations with narrative text. Embracing the existing web workflow shortens the time from idea to production-ready visualizations and empowers a wide range of people to create and use data graphics.

Noah Illinsky organizes Seattle’s Data Vis group.

Ryan Lucas presents his work on Variance Charts
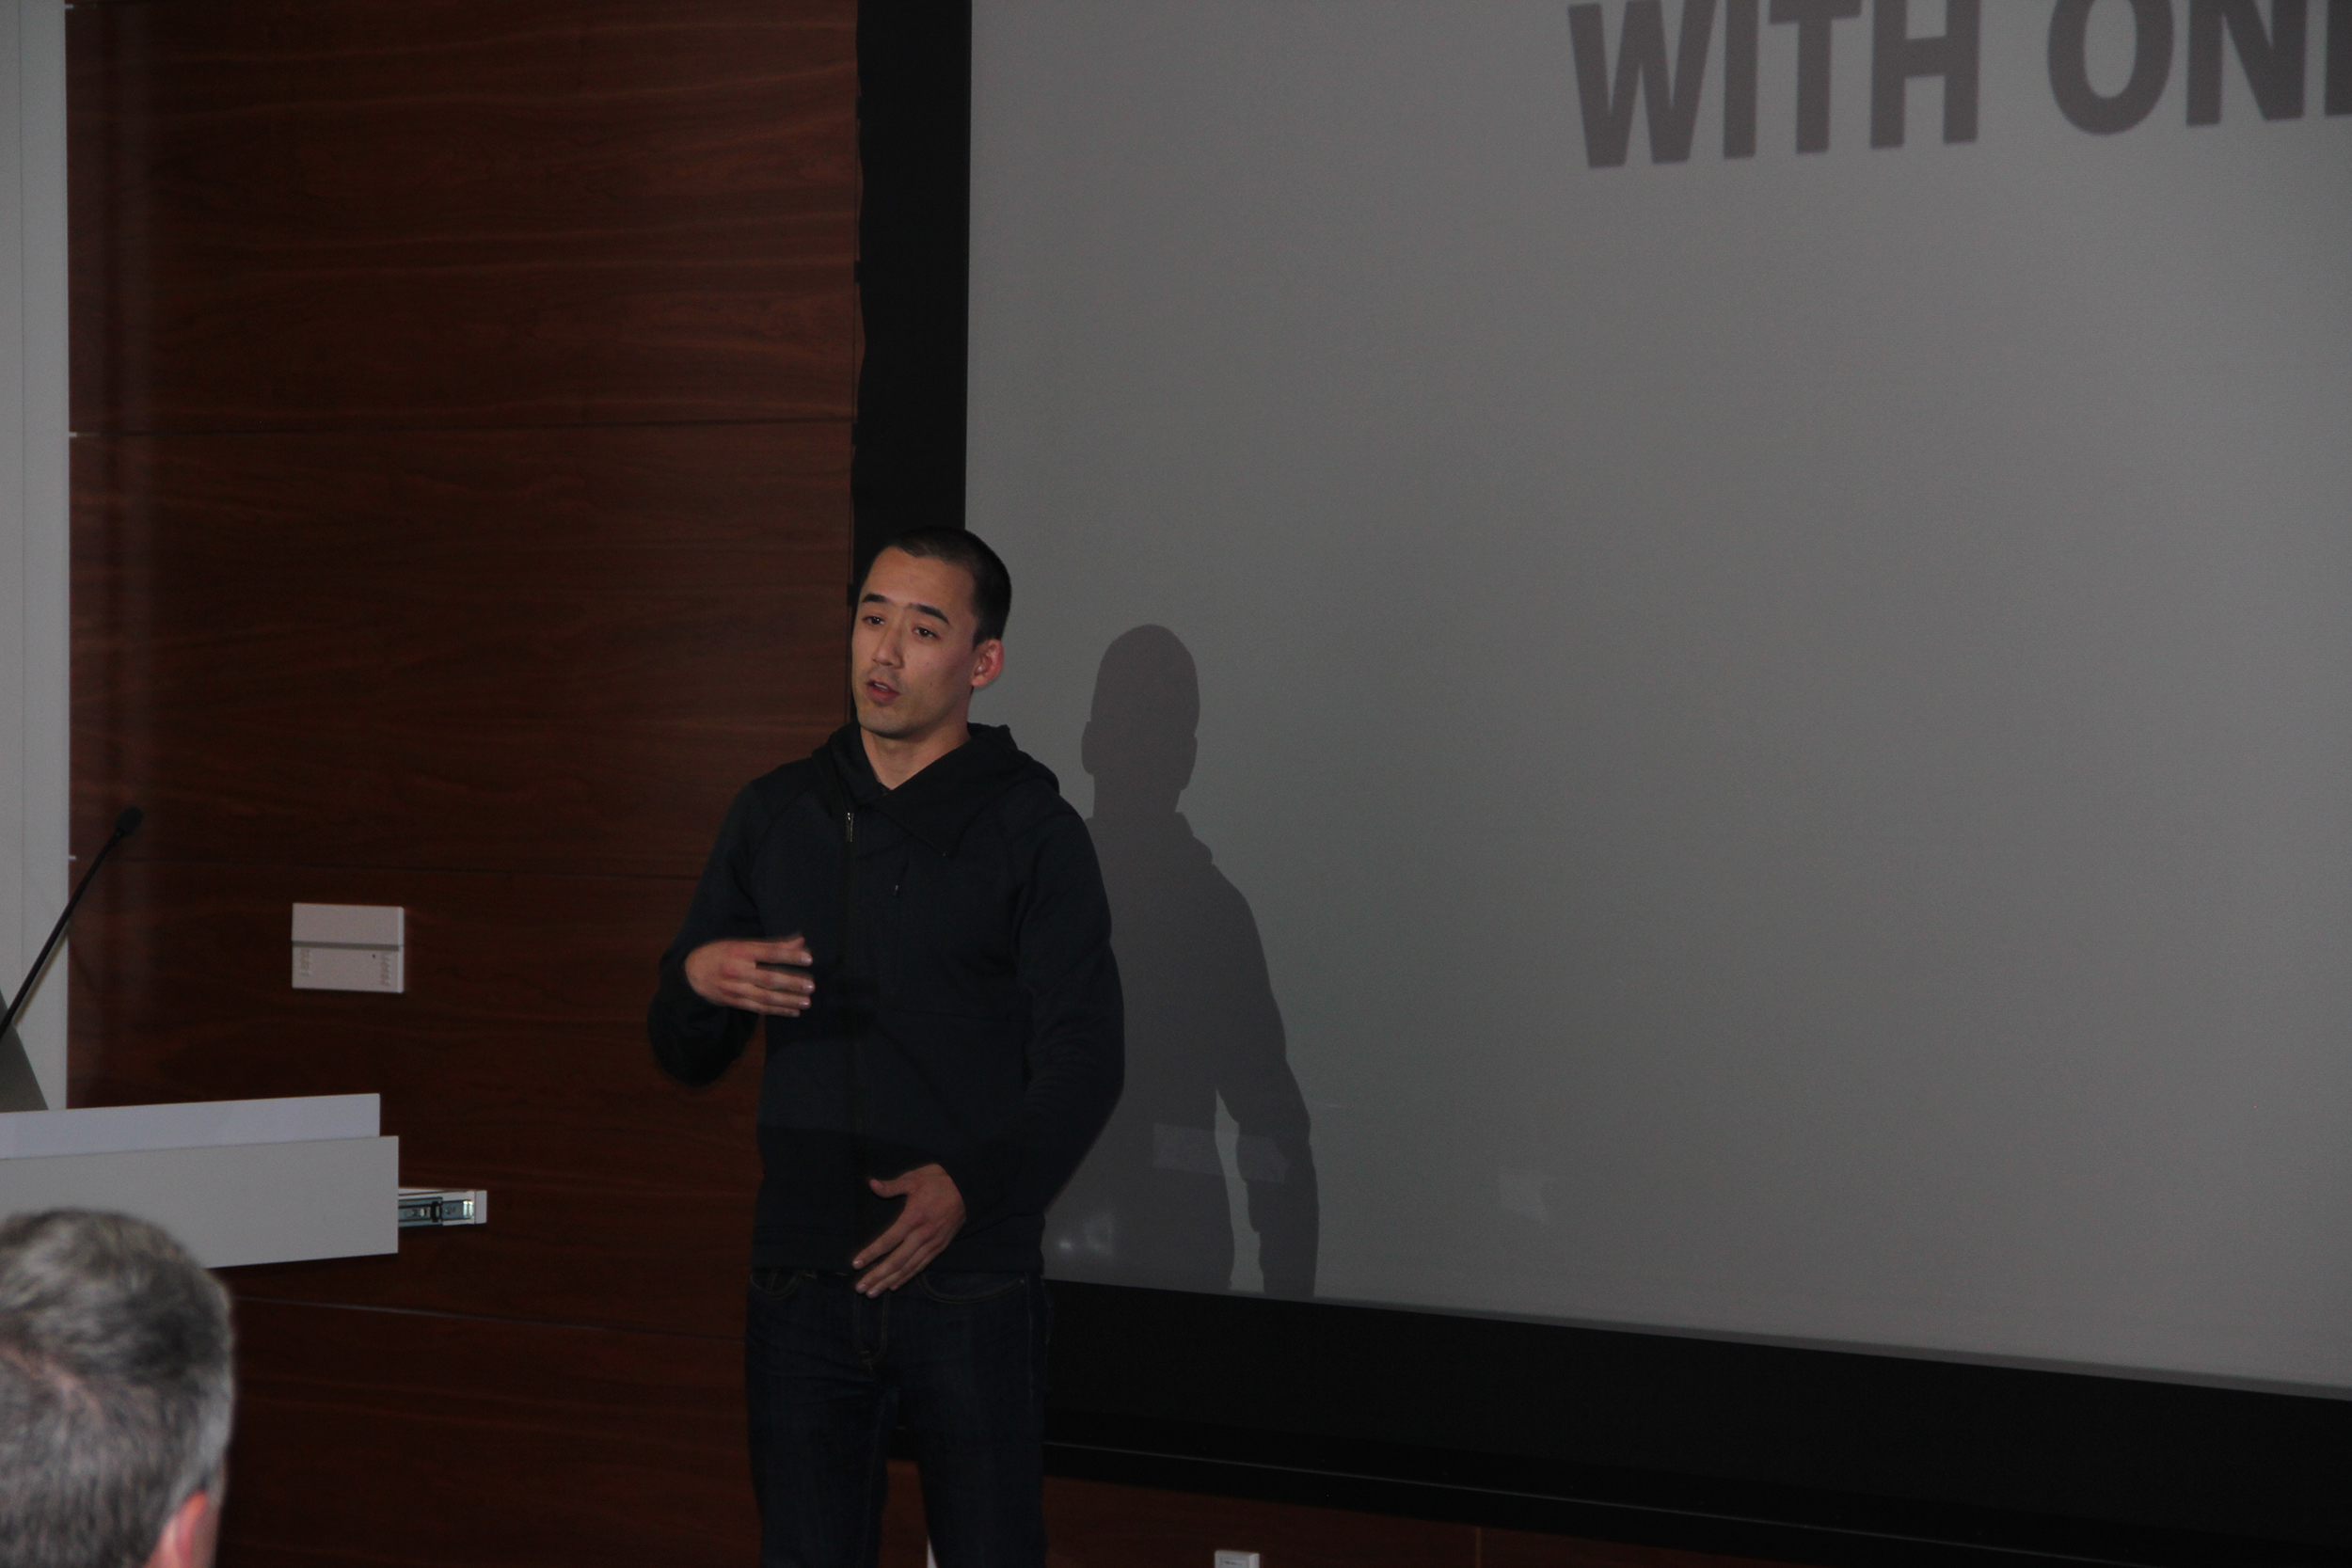
Kevin Lynagh presents his work on Variance Charts
